Thursday, May 28, 2009

Thursday 05/28/09 - Running on Empty

Today was bad from the get go; no motivation, lousy focus, and lack of sleep weighed on me, and I missed some nice trade sequences in the morning. The mind just wasn't sharp enough, and I was still half asleep when I got to the screens around 9:00 AM (central). Just felt super tired all day. I wasn't around much for the afternoon since I had to take care of some additional paperwork. I got back to the screens around 2:30 PM and placed 3 more trades into the close (2 winners, 1 loser). All in all, a pretty bad day but somehow managed to end with a +3.75 pt gain. For the full-time traders, how do you maintain focus throughout the day? Here are the Stats:

# of Trades 7
Longs 3
Shorts 4
% Break-Even: 0.00
% Win 57.14
% Loss 42.86
Avg Win 1.81
Avg Loss -1.17
Largest Win (pts) 2.50
Largest Loss (pts) -2.00
Total Win (pts) 7.25
Total Loss (pts) -3.50
Net Gain/Loss (pts) 3.75
ES Daily Range 22.50
P/L as % of Daily Range 16.67

GDP out at 7:30 AM tomorrow morning, Chicago PMI at 8:45 AM, and Consumer Sentiment at 8:55 AM.

ES (5-Min)


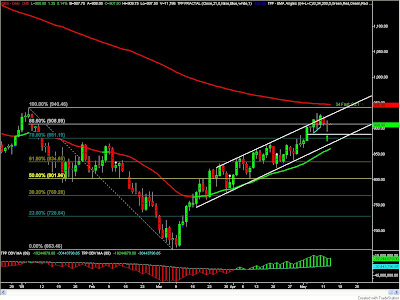
ES (Daily) - Lower high and lower low, with a Close near the highs on today's Daily candle. Support in the mid 880s below.

Wednesday, May 27, 2009

Wed. 05/27/09 - Chop chop, break!

No trades today as I was busy in downtown with paperwork for the new job and didn't get back home till after market close. Doesn't look like I missed much; the morning was a chopfest. I mark up the charts even on days I don't trade in order to further my education, and to keep up with the most recent price action, so here's my marked up 5-min chart:

ES (5-Min)


Lot of econ news out tomorrow. Durable Goods Orders and Jobless Claims at 7:30 AM (central), New Home Sales at 9:00 AM.

ES (Daily) - Bears can't get overly excited based on today's action since price simply pulled back to yesterday's 50% level. I'm sticking with Bullish bias until I see a CLOSE below 875 on the Daily chart.

Tuesday, May 26, 2009

Tuesday 05/26/09 - Parabolic Moves Suck

I don't like trading days like today where there's a quick parabolic move followed by a slow grind. I've seen these types of days before so I traded it as I knew best, which was by identifying the consolidation ranges and buying towards the bottom of the range. I'm glad I didn't attempt to Short the move, although I have to say the temptation was most certainly there. The disappointing part is, I had a Buy signal at 885 prior to the Consumer Confidence news, but didn't take it because I saw (perceived) weakness in the Energy sector (XLE). Perhaps I'm putting too much weight in the Energy and Financial sectors, and should just use them as a general barometer, rather than a criteria for trade entry. Any thoughts on this would be appreciated.

I only took three trades today so I'll go over them (Chart attached below)

Trade #1
Entered Long on small pullback at 900 around 9:30 AM (central). Moved stop-loss to break-even when position went 6 ticks in favor. I was stopped out at break-even a few minutes later, and price moved 4+ points in my favor immediately after I was stopped out (doh!)

Trade #2:
Entered Long at 904.75 around 10:50 AM. I definitely entered a bit early on this one; should have entered at 903.75, but it is what it is. I was using a 2-pt stop-loss, and price hit a low of 902.75 at 11:10 AM, and I was promptly stopped out for -2 pts. That was the Low point of the swing, and price didn't touch 902.75 for the remainder of the session (luck was def. not on my side today).

Trade #3:
Entered Long at 903.00 around 11:15 AM with a 6-tick stop-loss. Let this one run for +4 pts, and exited at 907.00 around 11:50 AM. I was expecting price to head higher, but didn't want to be greedy (Friday's Stop-Loss experiment showed that it's good to take profit once price has moved 4-5 pts in favor). I called it a day at this point since price was just chopping around.

ES (5-Min) - Trade Chart


Stats:

# of Trades 3
Longs 3
Shorts 0
% Break-Even: 33.33
% Win 33.33
% Loss 33.33
Avg Win 4.00
Avg Loss -2.00
Largest Win (pts) 4.00
Largest Loss (pts) -2.00
Total Win (pts) 4.00
Total Loss (pts) -2.00
Net Gain/Loss (pts) 2.00
ES Daily Range 32.75
P/L as % of Daily Range 6.11

Lot of Econ News out this week so there should be plenty of volatility in the markets. Expecting support at 893 and resistance at 916 and 923. Existing Home Sales data out at 9:00 AM tomorrow. Btw, I won't be trading tomorrow since I have to head to Downtown to take care of all the paperwork for the new job.

ES (Daily) - Today's bullish candle on the Daily took out the bearish movement of the previous 3-4 sessions.

Friday, May 22, 2009

Friday 05/22/09 - Stop-Loss Experiment

I went to bed around 2:30 AM last night, and slept in till 9:30 AM this morning. I got to the screens around 10:30 AM (central), and saw that price had bounced off 882, an area that I marked as support yesterday. I utilized just the 5-minute chart for trade placement today, and my focus was to experiment with my stop-loss management. I decided I would let the trade run and move my stop-loss to break-even once price had moved 2 points in my favor. My initial profit target was 4 points (1:2 R/R). I had a total of 3 trades.

Trade#1
I entered Long around 10:55 AM at 890.50 with a 2-pt stop and an initial 4-pt profit target. Once price moved 2 pts in my favor, I moved my stop-loss to break-even. Price then went 3 pts in my favor, at which point, it looked like I should exit the trade but I had to stick with the 4 pt target for this experiment's sake, and was exited at break-even around 11:25 AM (central).

Trade #2
I entered Long around 11:30 AM at 890, again with a 2 pt stop and 4 pt profit target. Once price moved 2 pts in favor, I moved the stop-loss to break-even. Price then continued and was +3.75 pts in my favor, a mere 1 tick away from my exit order. The 12:10 PM (central) candlestick signaled a reversal and I could have bailed for +3 points, but I stuck with the experiment and once again was stopped out at break-even at 12:35 PM.

Trade #3
I entered Long around 1:00 PM at 890.50, with a 2-pt stop and 4 pt profit target. I actually had to leave the house at this time, so put in the bracket orders for stop and profit, and left the PC. On this trade, price finally hit my profit target for +4 pts at 2:15 PM (central). The 2:20 PM candle would have signalled a short entry for me, but I wasn't at my desk.

ES (5-Min) - Trade Chart


I realize one day's price action doesn't say much, but it looks like I need to give my trades some room in the beginning. Moving stop-loss to break-even at +2 pts sounds reasonable from a risk management perspective. But then if I see a reversal signal, I also need to go ahead and exit at a profit. I easily left 3 pts on the table on my first two trades, so this could actually have been a +10 pt day in just 3 trades if I used discretion and exited the first two trades at a profit. Here's the Stats break-down:

# of Trades 3
Longs 3
Shorts 0
% Break-Even: 66.67
% Win 33.33
% Loss 0.00
Avg Win 4.00
Avg Loss 0.00
Largest Win (pts) 4.00
Largest Loss (pts) 0.00
Total Win (pts) 4.00
Total Loss (pts) 0.00
Net Gain/Loss (pts) 4.00
ES Daily Range 13.50
P/L as % of Daily Range 29.63

We have an open gap at 899.50, and at this point, the 876-882 area has proved to be support. Lets see if that holds next week. Have a fun and safe memorial day weekend!

ES (Daily) - Zoomed In. Price made a lower high and higher low today.

Thursday, May 21, 2009

Thursday 05/21/09 - Good News/Bad News

The good news is my job interview from the other day went well and I have an offer on the table. The bad news is, taking this job would force me to take a break from trading. I would still continue following the markets, and mark up the charts every evening, but obviously, I wouldn't be able to trade the market in real-time. On the bright side, it's a contract position so I could come back to trading in 6 months (if I don't renew my contract). I view trading as a long-term career option and not a get-rich-quick scheme, and at this point, it makes sense to take the job, reduce/eliminate liabilities to the point where I can take at least one year off and dedicate that time to trading the markets. Most businesses fail due to lack of capital, and I don't want that to be the case with my trading (business). On the plus side, the project I'll be working on sounds pretty cool and it's for a very large company which would look good on the resume. This isn't an easy decision for me since I really want to trade full-time.

With that out of the way, on to today's results. I mainly traded the morning and had some sweet short entries at 892.25 and 892 but was too quick to move my stop-loss to break-even, so both of those shorts were scratched. I re-shorted at 889.50 but covered too soon at 887.50. Scalped it short again for a few ticks. My biggest problem at this point is patience. I'm not patient with my winners or losers; I cut my winners quickly, and my losers even more quickly which is probably why I'm still net positive, but I'm not taking full advantage of my entries. The entries are good for 3, 5, 8 points per trade and I'm usually exiting with just 1-2 pts, which is disappointing to say the least. It's a personal/psychological problem. I just hate losing, and try too hard to keep my losses to a bare minimum, which results in missing out on potential gains. So the question is, are my early exits saving me enough money on my losing trades to make up for the lost gains on the winning setups? One solution is to use a "set it and forget it" trade management approach, where I would enter a trade with a preset stop-loss and profit target and let the market hit one of those orders instead of manually exiting the trade. I could also systematically move my stop-loss to break-even; for example stop gets moved to break-even once the trade goes 2 pts in my favor, etc. That way it's not purely discretionary. I'll have next week to experiment with these ideas. If you guys have any ideas, please post them in the Comments section. Here's how today's Stats broke down:

# of Trades 8
Longs 1
Shorts 7
% Break-Even: 25.00
% Win 62.50
% Loss 12.50
Avg Win 0.95
Avg Loss -0.25
Largest Win (pts) 2.00
Largest Loss (pts) -0.25
Total Win (pts) 4.75
Total Loss (pts) -0.25
Net Gain/Loss (pts) 4.50
ES Daily Range 15.50
P/L as % of Daily Range 29.03

There was plenty of Daily support in the 875-880 area, which provided a nice bounce into the close. On the Daily chart, today marked a lower high and lower low, but keep in mind we need to see a series of lower highs and lower lows in order to accept a possible trend reversal. The way I see it, today's bearish price action was still contained within the bullish Daily candle from 5/18/09. Price tested the lower price area but rejected it, and Closed at 888.75, and the Close is much more important than the Low. A Close below 876 would suggest a major turn in the markets. In support of the bears, Price broke below the bullish channel; not sure how big of a deal that is though since the channel was hand drawn by yours truly :D All that being said, as traders, we need to approach each day with No Bias...easier said than done.

Markets close early tomorrow; expecting a low volume day. Might be best to sleep in :-) Enjoy the long weekend all!

ES/$TICK (5-Min) - Open Gap at 899.50


ES (Daily) - Zoomed in

Wednesday, May 20, 2009

Wed. 05/20/09 - Last Minute Trade

As noted in yesterday's post, I had a job interview this morning which went pretty well, IMO, but you never know until they present an offer in writing. I got back home around 2:30 PM (central), and immediately fired up the trading PC to check the market...and wow, quite a nice reversal there. Saw a short setting up on the 5-min chart, waited for a couple of minutes, then jumped in short at 905; exited at 901 for +4 pts. Had a couple of small scalps in between and ended with a +5.00 pt gain, which took a whole 10 minutes. For tomorrow, looking for the 888-892 area to hold as support. Here's how the Stats broke down on my 10 minutes of trading:

# of Trades 3
Longs 0
Shorts 3
% Break-Even: 0.00
% Win 100.00
% Loss 0.00
Avg Win 1.67
Avg Loss 0.00
Largest Win (pts) 4.00
Largest Loss (pts) 0.00
Total Win (pts) 5.00
Total Loss (pts) 0.00
Net Gain/Loss (pts) 5.00
ES Daily Range 24.25
P/L as % of Daily Range 20.62

On another note, wanted to give provide an update on my friend who I'm currently teaching how to trade. This is his 4th week trading the ES with 1 contract, and currently his Net P&L is at +$4,363.20 after commissions (87.25+ ES Points Net!) and he still has 2 more days to go in the week. I'm rooting for him and shooting for a +$5K net gain which would mean a 100% return on an initial $5K account within 1 month. And please keep in mind that the simulated fills on the Infinity Sim are technically worst than realistic fills since the Sim doesn't fill your Sell order until the Bid moves to that price and doesn't fill your Buy order until that price is offered at the Ask. The gain was accomplished using 6-8 tick stops, and price action charts only (No Indicators, Moving Averages, Fibonacci, etc). He's proof that simpler is better.

Jobless Claims at 7:30 AM (central), Leading Indicators at 9:00 AM tomorrow morning.

ES/$TICK (5-Min)


ES (Daily) - Watching 888-892 for support

Tuesday, May 19, 2009

Tuesday 05/19/09 - Trend Trades Only

Weather is really nice out, so just making a quick post to note today's results, and then time to go out for a ride on the ZX6R :-) Better discipline today, and by no surprise, better results. Here's how today's Stats broke down:

# of Trades 6
Longs 6
Shorts 0
% Break-Even: 0.00
% Win 66.67
% Loss 33.33
Avg Win 2.38
Avg Loss -1.75
Largest Win (pts) 4.25
Largest Loss (pts) -1.75
Total Win (pts) 9.50
Total Loss (pts) -3.50
Net Gain/Loss (pts) 6.00
ES Daily Range 12.25
P/L as % of Daily Range 48.98

Note that all trades were in direction of trend; quite the opposite compared to yesterday's performance. I didn't trade the afternoon session which provided a short setup.

On another note, I have a job interview tomorrow morning, so my trading ambitions may get put on hold if I get an offer. We'll see...

ES/$TICK (3-Min)

Monday, May 18, 2009

Monday 05/18/09 - Knowledge Alone is Insufficient

Execution is key. Simply "knowing" what to do is not enough. For example, I've been anticipating the 876 level to serve as support and noted the following in Friday's post: "Price still within bullish channel, and 876 low from 05/04/09 was held today." I also recognized that the trend was clearly up today, and that I should be buying the dips, yet when it came time to execute, I continued entering short positions all day, which resulted in a -5.50 pt loss. I was confused with the price action for better part of the day since price would shoot up, and then consolidate for what seemed like an eternity. Most of my break-even trades went 5-7 ticks in my favor but I tried being patient and holding for larger gains, but that didn't work out for me. I realized I was taking counter-trend trades, and that I should just bail for +6 ticks but again, even though I knew what I "should" be doing, I failed to act on the information and continued holding for larger gains which never materialized. Not much else to say except I'll try to do better tomorrow. Stats:

# of Trades 24
Longs 4
Shorts 20
% Break-Even: 41.67
% Win 8.33
% Loss 50.00
Avg Win 2.00
Avg Loss -0.79
Largest Win (pts) 3.00
Largest Loss (pts) -1.75
Total Win (pts) 4.00
Total Loss (pts) -9.50
Net Gain/Loss (pts) -5.50
ES Daily Range 19.75
P/L as % of Daily Range -27.85

Housing Starts data released at 7:30 AM (central) tomorrow, along with Redbook at 7:55 AM. Looking for the 887-895 area to hold as support; 910-915 as resistance.

ES/$TICK (3-Min) - Open Gap at 882.50


ES (Daily) - 876 level held as support. Price still within bullish channel.

Friday, May 15, 2009

Friday 05/15/09 - No Trades

Turned 26 today, and decided to sleep in since I was up till 2 AM last night finishing some web dev work, and late night reading (check out the Success and Motivation post on Mark Cuban's Blog). As mentioned in yesterday's post, Max Pain Theory predicted price to be in the $87 area for SPY (870s for S&P500 Index). I don't really have much faith in Max Pain, but it's good for entertainment value, and price did come down to 876.75, so maybe I should continue to track it over the next few months and see if it's worth a look. I was busy with web development a good part of the week, and trading was not the main focus. I plan on wrapping up the Web Dev stuff over the weekend so I can focus on trading next week. Ended the week with a net gain of +17.25 pts trading 3 out 5 days, with one of those days dedicated to experimentation. I have high hopes for next week's results.


ES (Daily) - Price still within bullish channel, and 876 low from 05/04/09 was held today.

Thursday, May 14, 2009

Thursday 05/14/09 - Easy reads today

Today was an easy day to trade, IMO. I wasn't able to trade the afternoon, but netted +10.00 pts in the first half of the day. Today could also have been a 15+ pt day but I got low ticked out of a Long at 885.25 in the morning; my stop was at 883.50, and that turned out to be the swing low at 9:51 AM (central), after which price headed straight up to 888+. I jumped back in at 884.50 but exited too soon at 886. My exits need a LOT of work. Aside from that, was busy finishing up the web development project I've been working on for most of the week (didn't trade or post yesterday since almost all day was spent on web dev). Here's how the Stats broke down today:

# of Trades 16
% Break-Even: 0.00
% Win 75.00
% Loss 25.00
Avg Win 1.21
Avg Loss -1.13
Largest Win (pts) 3.50
Largest Loss (pts) -2.25
Total Win (pts) 14.50
Total Loss (pts) -4.50
Net Gain/Loss (pts) 10.00
ES Daily Range 15.50
P/L as % of Daily Range 64.52

Turning 26 in a couple of hours here, while Matt's turning 23 at the same time (yes, we have the same b-day). Lets see if he changes his Blog title to "By Age 24" :D

I'm not sure whether I'll be trading tomorrow, but if I do, I'll be keeping an eye on 887 as support and 898 as resistance. It's options expiration so I'm expecting some see-saw price action. According to the Max Pain Theory, the S&P should be around 870 tomorrow. Consumer Price Index out at 7:30 AM, Industrial Production out at 8:15 AM, and Consumer Sentiment out at 8:55 AM (central).

ES/$TICK (3-Min)


ES (Daily) - Price still within bullish channel

Tuesday, May 12, 2009

Tuesday 05/12/09 - Never Be Satisfied

I'll never be 100% satisfied with my results as there's always room for improvement, but I'm particularly disappointed in today's results (+7.00 pts) because of the (easy) opportunities available today. For example, I was short at 911.75 during the open, and exited for ONE point at 910.75 even though the charts gave me absolutely no indication to exit. I was also Long at 899 and 901.50 in the afternoon before ES rocketed back up, and on both occasions I exited for 2-3 ticks. Both of these sequences were "no heat" sequences, meaning price never really went against me so I took no heat on the positions. The quick exits would be fine if my style was closer to Don Miller's or if I was trading his size (30-100+ lots); but neither of those apply to me. I trade 1-2 contracts, and risk 5-8 ticks to make 3-5 Points. The method supports it, and today the market supported it. My style of trading doesn't work too well on narrow range days (working on improving there too btw), which means I need to push the accelerator when the market sets itself up to be in sync with my method. The only excuse I can fall back on today is that I was busy coding an e-Business website enhancement for one of my clients, so I wasn't 100% focused on the market (or the coding for that matter). But deep down I know that's all it is; an excuse, because I should have nailed the opening sequence. I also made the mistake of trying to catch a falling knife which cost me -5.00 pts.

As an intraday trader, I believe I should be able to capture at least 50% of the day's range, so I've added the ES Daily Range and P/L as % of Daily Range to my metrics to track how much of that daily range I'm able to capture. Here's how the Stats broke down for today:

# of Trades 36
% Break-Even: 30.56
% Win 50.00
% Loss 19.44
Avg Win 0.79
Avg Loss -1.04
Largest Win (pts) 2.00
Largest Loss (pts) -2.00
Total Win (pts) 14.25
Total Loss (pts) -7.25
Net Gain/Loss (pts) 7.00
ES Daily Range 19.50
P/L as % of Daily Range 35.90

Looking ahead, bullish bias still intact, in my opinion. Yes, we've moved lower but price was unable to take out the 893.50 low from 05/05/09, and closed above 900. 887-891 area is important. I'll also be watching the 901-904.50 area for support; 910 and 918 areas for resistance. Retail Sales data out at 7:30 AM (central) tomorrow.

ES/$TICK (3-Min) - Gap filled in the first 10 minutes


ES (Daily) - Perspective

Monday, May 11, 2009

Monday 05/11/09 - Forward Testing

Initially, I manually back-test new ideas on past charts, but to develop faith and confidence in the method, it must prove itself in real-time (forward-testing), and I certainly place more emphasis on real-time testing. I added the S&P 500 Adv-Decl Issues Diff ($ADSPD), the NYSE Adv-Decl Issues Diff ($ADD), the NYSE Up-Down Volume Diff ($VOLD) to my charts to more closely monitor market breadth so today was spent experimenting in real-time. The morning was spent exlusively on experimenting with different setups and resulted in a -6.75 pt loss. In the afternoon, I switched gears back to my existing method and banked +7.00 pts to end the day in the green by 1 tick (minus commissions). I will continue studying the newly added market breadth indicators to get familiar with them. I didn't expect to make much off the added information on the very first day so I'm not at all disapponted. It was good to see that I could make it all back trading the way I already do, in a narrow range market which isn't condusive to my style of trading since I look for trend continuation, range extensions and break outs. Here's how the Stats broke down for today:

# of Trades 31
% Break-Even: 12.90
% Win 51.61
% Loss 35.48
Avg Win 0.95
Avg Loss -1.36
Largest Win (pts) 3.00
Largest Loss (pts) -1.75
Total Win (pts) 15.25
Total Loss (pts) -15.00
Net Gain/Loss (pts) 0.25

A pullback is not only normal, but healthy after a rally, so today's down move is fine by me. We also filled the open gap at 907.75 from last Friday. I just hope it turns out to be bulls re-fueling, rather than a total reversal in trend. I trade short-term so it really doesn't affect me whether the market moves up or down, so long as it MOVES, but I'd like to see further upside movement to at least the 940 area on the S&P. I'll be watching the 901 area for support, then 898, 894.75, 891, 887 and 881. On the upside, I'll be watching the 910 and 914-918 area for resistance. We also have an open gap above at 924.25.

ES/$TICK (3-Min) - Open Gap above at 924.25

Friday, May 8, 2009

Friday 05/08/09 - Focus on 3-min Chart

I missed the first 45 minutes, but then managed to put on a couple of good trade sequences between 9:30 AM and 11:00 AM resulting in a net gain of +10.25 points (half of that was from one trade). I stopped trading at 11:00 AM due to errands in downtown. I focused on the 3-minute chart today, which produces very nice setups but requires a slightly wider stop-loss (3 pts), which so far has produced decent results. I'll continue experimenting with it next week while I improve my execution. Here's how the stats broke down today over 7 trades:

% Break-Even: 28.57
% Win 57.14
% Loss 14.29
Avg Win 2.69
Avg Loss -0.5
Largest Win (pts) 5.00
Largest Loss (pts) -0.50
Total Win (pts) 10.75
Total Loss (pts) -0.50
Net Gain/Loss (pts) 10.25

No losing days this week, and a weekly gain of +38.75 points.

Going into next week, we have open gaps below at 907.75 and 876.50. Still looking for ES to hit 940; but trading what I see (momentum). Looking at the 60-min chart, I'm noticing an exhaustion in this up move and 927 is proving to be resistance. I'd like to see a 60-min candle CLOSE above 927 for continued upside action. Have a good weekend all!

ES/$TICK (3-Min) - Open Gap below at 907.75


ES (Daily) - Perspective

Thursday 05/07/09 - Pullback on Profit Taking

I was busy with web development again today, and wasn't around to trade the first hour. I placed a few small trades during the course of the day ending up with a net gain of +6.75 points. I had some solid entries but left a lot of profit on the table so I would have to grade my performance as a B- today. This could have easily been a +10-15 pt day. Here's how the stats broke down today:

% Break-Even: 9.09
% Win 72.73
% Loss 18.18
Avg Win 1.16
Avg Loss -1.25
Largest Win (pts) 2.00
Largest Loss (pts) -1.50
Total Win (pts) 9.25
Total Loss (pts) -2.50
Net Gain/Loss (pts) 6.75

A pullback on profit taking was expected so no surprises today. 898 area held support. I'll be keeping an eye at the 894, 887, and 879 areas for support if we head lower tomorrow. On the upside, I would love to see 940! Not really much else to report except that my schedule is working out really well for me and keeping me out of trouble. An update on my friend who's learning how to trade from me: he has been averaging +5 pts per day for the past two weeks, and ended today with a +8 pt gain. Just want to reiterate that I taught him only the basics on price action/trend, and did not put even one indicator on his chart. The results have exceeded my expectations. He has been trading on Infinity's Sim, and will be funding his account in the next month or so. I'm looking forward to this real $ results, and am confident they will be similar to his Sim results since he has the proper mindset, and is using tight risk management in his Sim trading (6-8 tick max stop-loss).

Employment Situation (Nonfarm Payrolls, Unemployment Rate, Avg Hourly Earnings, Avg Workweek) released tomorrow morning at 7:30 AM (central)

On to the charts...

ES/$TICK (3-Min) - Gap filled by 9:06 AM.


ES (Daily) - Perspective

Wednesday, May 6, 2009

Wed. 05/06/09 - Solid trades

I was busy most of the day with some web development work for one of my clients (sim trading doesn't pay well), but I kept my 3-minute chart up on one of my screens and took a few setups today which resulted in a net gain of +10.75 pts, and that's with a couple of bad entries where I got stopped out, and a couple of early exits. Using the 610 Tick Bar chart in conjunction with the 3-minute would have helped me time my entries better. The newly implemented Trading Schedule also really helped! I would grade today's trading as a solid B+. I've marked up some of the trades on the 610 Tick Bar charts below.

Going forward, I'll be looking at the 910 area to provide light support; 900 area to provide solid support, 887-890 underneath that level as support "foundation". A pullback on profit taking is to be expected, but until those areas are taken out, the market's bias is bullish in my opinion.

Jobless Claims and Productivity and Costs data out tomorrow at 7:30 AM (central). Ben Ber"tank"e speaks at 8:30 AM, but that should be a non-event, EIA Natural Gas Report out at 9:30 AM.

On to the charts...

ES 610 Tick Bar Chart (Morning Trades)


ES 610 Tick Bar Chart (Afternoon Trades)


ES 610 Tick Bar Chart (Late Afternoon / Closing Trade)


ES/$TICK (3-Min) - Gap filled by 9:30 AM. $TICK MAs above zero most of the day.

Tuesday, May 5, 2009

Trading Schedule

I've been meaning to put together a structured trading schedule for a while now, and although I don't know what the optimum schedule is, Ill start with the following (all times are Chicago/Central time zone). This doesn't include:

8:15 AM (7:15 AM for Early Econ Release)
  • Power up the charting platform and snap lines to mark the Globex support/resistance levels. This information will assist me in making sense of the opening range (first 15-minutes of market open)
  • Check for News and U.S. Economic Data
8:30 AM - 8:45 AM
  • Extra caution during opening range. Indicators are relatively useless during this period. Focus is on overnight support/resistance as well as significant pivot from prior day's price action.
8:45 AM - 11:30 AM
  • This is GO TIME. Active trading. Take every setup that offers favorable risk/reward in direction of trend.
11:30 AM - 12:45 PM
  • Lunch time. Step away from the screens!
12:45 PM - 1:00 PM
  • Return to screens. Assess current price action and prepare for 1 PM.
1:00 PM - 2:45 PM
  • GO TIME. Active Trading. Take every setup that offers favorable risk/reward in direction of trend.
2:45 PM - 3:15 PM
  • In general, avoid entering new positions and look to close out open positions. Sometimes this time-frame does offer "gifts" so be extremely selective in initiating a new trade. No hard fast rule to "stay out of trades". This is a trade settlement time-frame, where traders may be exiting losing trades to avoid holding overnight, so be extra mindful of the winners and losers based on the day's price action.
I'll update and tweak this schedule as I see fit, but I think this is a good first draft. If you have any thoughts or recommendations, post away in the comments section.

Tuesday 05/05/09 - Minor Pullback

Narrow range day today (11.25 pts). 887-890 was solid support in the ES, but we did get several opportunities to short at the mid-point. With the big up-trend day yesterday, consolidation in this area was expected. But typically when price is below the 1st hour low in the afternoon, it tends to close at or near the lows so I was expecting a break of 894, which we got but without any follow through. Instead, price hit 893.50, and then quickly re-bounded back up. The NYSE $TICK moving averages also hovered close to the zero-line most of the day which is usually a recipe for choppy price action. On the 60 min chart, today's pullback was very minor (23.6% retrace of 862.50-904.75), so the bias is still bullish but everyone and their mother can see that price is getting over-extended to the up-side here. But maybe that's the problem: everyone's expecting a pullback, which is a good reason for price to continue moving up.

I was able to scalp for +6.25 points. I didn't have time to markup the trades on my chart today but gains were split pretty evenly among Long and Short trades.

This brings me to a question; do you adjust size and risk management parameters on consolidation days (day after big trend)? If so, what kind of adjustments do you make? For example, reviewing today's price action, there were several areas where you could be in a trade, and ADD to your position even if it went against you by a few ticks, and still have manageable risk on the trade since the support/resistance areas were clearly defined, and a big up/down move wasn't expected.

On to the price action charts...

ES 610-Tick Bar Chart (Open and Morning Price Action)


ES 610-Tick Bar Chart (Afternoon Price Action)


ES/$TICK (3-Min) - Notice where $TICK MAs spent most of their time

Monday, May 4, 2009

Monday 05/04/09 - ES Over 900 (Finally!)

I've been expecting (hoping for) a break above 900 for a while, so it's good to see it finally materialize. Unfortunately, price didn't pullback much so it was tough finding a good area to buy. If you didn't buy on the pullback to 889, you were left trading consolidation chop. My problem is, after ES makes a big up move, I have a hard time entering Long because I feel like price is "too high" and will reverse on me. Price has reversed hard so many times off the intraday high in the past few weeks, that it's a little scary buying above the first hour high; especially when price is so close to 900, which a lot of people perceive as a psychological barrier or resistance zone. Bottom line is, I need to set my biases aside and trade price. As day traders, we don't buy/sell value so the specific price shouldn't matter. We trade momentum. So as long as momentum is supporting the direction of my trade, I shouldn't be afraid to get in. Here's how today broke down in terms of performance across 18 trades:

% Break-Even: 31.58%
% Win 47.37%
% Loss 21.05%
Avg Win 1.00
Avg Loss -0.425
Largest Win (pts) 2.00
Largest Loss (pts) -1.50
Total Win (pts) 9.00
Total Loss (pts) -4.25
Net Gain/Loss (pts) +4.75

At this point, I'm looking for 879 to hold as support on a pullback.

I'll post a marked up 610 tick bar trade chart; it doesn't have all of my trades, just the ones I had time to mark in real-time. I'm using Infinity's execution platform so the trades aren't auto-plotted on my TradeStation charts now.

ES 610 Tick Bar Chart (Morning Trades)


ES 610 Tick Bar Chart (Afternoon Trades)


ES/$TICK (3-Min) - Open Gap at 876.50


ES (60 Min) - Looking for 879-886.75 as an area of support on a pullback

Friday, May 1, 2009

Friday 05/01/09 - Positive Day

I only traded for a couple of hours today (10:30 AM - 12:30 PM central) since I was at the condo in the morning, and busy with other errands in the afternoon, and although today's P&L reads +$212.50, I'm much more satisfied with my trading today (grade of B-) compared to yesterday's +$1,100 gain, which I graded as a C-. My discipline was better today, although there's still room for a ton of improvement. You can check the Trade Chart to get an idea of my primary trades for the day, but basically, scalped long at a support level; scalped short at trend-line resistance, and then scalped long again once trend-continuation was confirmed, and exited on the stop-run that ensued once ES broke to a new high of day. That's it...pretty simple and straight forward trades today.

ES 610-Tick bar Chart (Trades)


My bias continues to be to the upside. At this point, if ES breaks below 850, bias switches to neutral. A break below 830 and the bears are back in control. That's all for today folks! Have a nice weekend :)

ES/$TICK (3-Min) - Gap filled within the first 20 minutes of market open. Over 100,000 contracts traded at the close with an 8 point up-move; I'm guessing that was mostly Shorts covering their position.


ES 60-Min - Bounce off the 50% retracement; Close above the 23.6%. Lookin good for the Bulls