Thursday, December 31, 2009

Thursday 12/31/2009 - E-Mini S&P 500 Futures Review

E-Mini S&P 500 Futures Review/Analysis
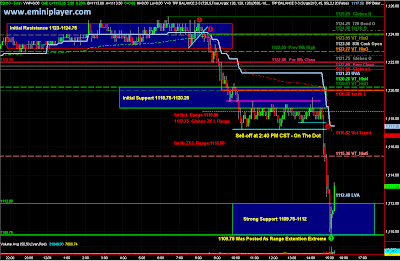
The Initial Resistance Zone (1123-1124.75) held overnight, and we got a break below this area at the cash open. After a small and short-lived bounce in the Initial Support Zone (1118.75-1120.25), price broke through it and found support at 1117.25. Price remained in a 2 point range from 10:20 AM (CST) - 2:35 PM (CST). The sell-off I mentioned in last night's post came right on time around 2:40 PM (CST). The Low of Day was set at 1109.75, which was highlighted as the Range Extension Extreme on the Key Levels chart. ES closed at 1113.25, above the Strong Support Zone (1109.75-1112). The daily range including Globex session was 15.5 points (1109.75-1125.25), right around the average range for the last session of the year (14 pts).

2009 has been a very educational year for me, and I'm looking forward to making even more progress in 2010! Wish you all the best!

ES 5-Minute Chart for 12/31/09 Includes Overnight Globex
ES 5-Minute Chart

Key Support/Resistance Levels (S&P 500 Futures) for Thursday 12/31/2009

Key Support/Resistance Levels & Scenario
We saw responsive buyers come in at the 1113 level and push the market back to 1122 (closed near high of day). My bias is bearish below 1118.75, bullish above 1125 and neutral/bullish in between. The average range for the last session of the year (1999-2008) is 14 points, and that figure can be used as a reference point if you're looking to fade the range extremes. Another interesting thing I noticed is that the market has a tendency to sell off and whipsaw during the last 15-20 minutes of the last session of the year (2:40 PM CST - 3:00 PM CST), so be mindful of that if you're in a Long position around that time. I'm not saying that WILL happen tomorrow because no one knows what WILL happen, but it's something to be aware of. As Mark Twain said, "History doesn't repeat itself, but it does rhyme." Aside from that, I'm anticipating range expansion. Jobless Claims data out at 7:30 AM CST in the morning. Refer to the Volume Profile chart for specific levels/areas.

ES - Daily Bar Chart with Volume Profile and Key Levels

Wednesday, December 30, 2009

Wednesday 12/30/2009 - E-Mini S&P 500 Futures Review

E-Mini S&P 500 Futures Review/Analysis
1110.75-1112 was posted as a Strong Support Zone, and we saw responsive buyers come in at 1113, and push price higher. 1122-1125 was an Area of Resistance, and that held as well. Price remained range-bound within the Initial Balance for the entire day session. Check out the annotated 5-min chart below to see how the day played out.

ES 5-Minute Chart for 12/30/09 Includes Overnight Globex
ES 5-Minute Chart for 12/30/09

Tuesday 12/29/2009 - E-Mini S&P 500 Futures Review

E-Mini S&P 500 Futures Review/Analysis
The scenario posted last night called for a trend day, and to trade in direction of the econ news reaction, which in today's case, was clearly down! The plan worked out well and hope you were able to capitalize on the symmetrical down swings in the morning. Btw, 1127 was the Upper Target I posted on Chart.ly on Dec 8th (link to chart) and we hit it today.

I drove out to the suburbs earlier tonight to spend a couple of hours with my 3-yr old nephew and it's already past 12:30 AM so no Key Levels/Scenario post tonight. The key levels posted last night are still in play, except 1123-1125 is an area of resistance now. Bias is bearish below 1125, and bullish above it. Trade well!

ES 5-Minute Chart for 12/29/09 Includes Overnight Globex

Monday, December 28, 2009

Key Support/Resistance Levels (S&P 500 Futures) for Tuesday 12/29/2009

E-Mini S&P 500 Futures
I'm anticipating range expansion on the Consumer Confidence econ# out at 9:00 AM (cst) tomorrow morning. Other Econ data to be mindful of is the S&P Case-Shiller Home Price Index out at 8:00 AM (cst) and Redbook at 7:55 AM (cst). Near-term bias is bullish, but a pullback to 1112 would not surprise me. I'm anticipating a trend day, and will look to the price action following the Consumer Confidence # to set the mood/direction for the remainder of the day. Plan would be to stay in trend trades a bit longer, and exit out of counter-trend trades ASAP. I would caution against shorting above the Initial Balance unless we're at a range extension extreme like 1131.50 or the 1133-1135 area. On the downside, I'm anticipating the 1112 area to hold, even on negative econ data. The dismal volume makes it difficult to judge buyer/seller conviction, but Buyers are clearly in control at the moment.

ES - Daily Bar Chart with Volume Profile and Key Levels
Daily Bar Chart with Volume Profile and Key Levels

Monday 12/28/2009 - E-Mini S&P 500 Futures Review

E-Mini S&P 500 Futures Review/Analysis
The scenario from last night anticipated range-bound trade within the Globex High and Low, and that played out well in the market today. Globex High was 1125.50, and the high of day was put in place early in the morning at 1126.25 (3 ticks above Globex!). Price couldn't even reach Globex Low, and instead found buyers at the previous day's mid-point at 1119.50. Price retraced and closed at 1123 (within the Initial Balance and Value Area, above the Mid-Point, and a tick above the VWAP).

Near-term bias is stil bullish, but tomorrow's Econ data could upset that. Anticipating range extension tomorrow.

ES 5-Minute Chart for 12/28/09 Includes Overnight Globex
ES 5-Minute Chart for 12/28/09

Sunday, December 27, 2009

Key Levels & Scenarios (S&P 500 Futures) for Monday 12/28/2009

E-Mini S&P 500 Futures
Psychologically, the toughest trade tomorrow morning is going to be Buying, which is exactly why continued UP movement wouldn't surprise me. I believe the market is at an inflection point; we either solidify and build a base in the 1109-1122 area and move up towards the 1180 level - OR - we run the stops, and then fail hard! I'm not anticipating this big picture scenario to play out this week, but it's something to be aware of.

Scenario
For tomorrow, I'm anticipating a range-bound day. Use the Globex High/Low to get an estimate of the day's range. Unless price is moving on high momentum and volume, I would look to fade the Globex High and Low on first touch. Price has already hit my initial upside range extension level and retraced 1.50 points in the overnight session.

ES - Daily Bar Chart with Volume Profile and Key Levels

Thursday, December 24, 2009

Thursday 12/24/2009 (Christmas Eve) - S&P 500 Futures Market Review

E-Mini S&P 500 Futures
We finally tagged that 1122 Level I've been posting for a while now. The market closed near the high of day, which indicates strength and unfinished business in the 1120+ area, and leads me to anticipate upward continuation into early next week.

Have a happy and safe holiday!

ES 5-Minute Chart for 12/24/09 Includes Overnight Globex

Wednesday, December 23, 2009

Wednesday 12/23/2009 - S&P 500 Futures Market Review

E-Mini S&P 500 Futures
The key levels worked very well today. The overnight stop run above the previous high of day paused at 1119 to the tick -- and that level worked multiple times. Sellers kept price under 1121, and shorting below 1122 with a tight stop was fine. The morning sell off stopped and reversed at the Initial Support Zone. Sellers kept price under the IB High (was also the High of Day) in the PM session. I was anticipating another stop-run if the buyers had been able to push price above 1117.25 in the afternoon. 1117.25 is now acting as Resistance in the overnight Globex session. The charts below show how the Levels worked out.

I won't be posting Key Levels tonight since tomorrow is a short day. 1119-1121 is still the Resistance Zone to watch. Above 1122, we could easily get to 1127.

Best wishes to everyone this holiday season! 2009 has been a very educational year and I feel confident going into 2010!


ES 5-Minute Chart for 12/23/09 Includes Overnight Globex


ES - Volume Profile and Key Levels 12/23/09

Tuesday, December 22, 2009

Key Levels & Scenarios (S&P 500 Futures) for Wednesday 12/23/2009

E-Mini S&P 500 Futures
Three important economic releases tomorrow morning: Personal Income and Outlays at 7:30 AM (cst), Consumer Sentiment at 8:55 AM (cst), and most importantly New Home Sales at 9:00 AM (cst). I'm anticipating range expansion on the New Home Sales data. My bias is bullish above 1110.50, bearish below 1107 and neutral to bullish in between. Watch out if we get above 1122; anticipating a stop-run to cause a strong upward surge. Beyond 1122, there's no use estimating the range potential since it's a fresh and untested scenario and price area. All I can say is, keep your subjective bias in check. Instead, identify key reference points to establish directional bias objectively. Be careful with counter-trend trades; we're at an inflection point and could get a strong trend day. Also have to be extra cautious since it's a short week and there's little to no participation from the big institutional players.

ES - Daily Bar Chart with Volume Profile and Key Levels

Tuesday 12/22/2009 - S&P 500 Futures Market Review

E-Mini S&P 500 Futures
It was low volume chop day, but the key levels worked very well. The Initial Resistance Zone of 1112-1113.50 acted as resistance in the overnight Globex session, and price paused there several times. The GDP release pushed price down to 1110 and it became a swing low, and thus a key reference point (I took a Fib measurement of this swing to get some range extension targets if price reversed to the upside). Price pushed up to 1115.75 on the Existing Home Sales #, but couldn't get beyond that. You can see on the 5-min chart that price hit that level 4 times, and couldn't get through it, and it was a low-risk area to initiate a short with a tight stop. From there, we sold off the IB low, but 1110-1110.75 was support and the 1110.50 low was rejected. 1112 was previous day's IB High. I posted the 1112 level on Twitter/StockTwits several times in the afternoon (bullish above 1112, bearish below). It was a key reference point to establish a short-term bias, and served me well.

ES 5-Minute Chart for 12/22/09 Includes Overnight Globex

Monday, December 21, 2009

Key Levels & Scenarios (S&P 500 Futures) for Tuesday 12/22/2009

E-Mini S&P 500 Futures
Two important economic releases tomorrow morning: GDP at 7:30 AM (cst) and Existing Home Sales at 9:00 AM (cst). My bias is bullish above 1103 and bearish below it. ES is already trading very close to the initial resistance zone (1112-1113.50), and may even take it out overnight. Aside from the moves driven by economic news, I'm anticipating rotational price action between the support and resistance zones. Don't be afraid of the Long side; if we continue moving higher, the stops above will carry Long positions well into the black. Must be cautious on both sides though since it's a holiday week and end of the year. Thin markets can move farther than we may think.


ES - Daily Bar Chart with Volume Profile and Key Levels

Monday 12/21/2009 - S&P 500 Futures Market Review

E-Mini S&P 500 Futures
My bias was bullish above 1099, which means caution on the short side above that level, only initiating shorts at the extremes (range extensions). When price rocketed through the initial resistance zone (1104.75-1106.50), it was a sign that the move was strong, and to definitely stay out of shorts. Price paused and rotated at the strong resistance level (1109.50), but then continued up to the range extension area and the brakes were finally put on at previous week's high. Once price moved through the resistance zone (1108.25-1109.50), resistance became support and we got two bounces off the area. Price closed above the mid-point and inside the value area.

ES 5-Minute Chart for 12/21/09 Includes Overnight Globex

Key Levels & Scenarios (S&P 500 Futures) for Monday 12/21/2009

E-Mini S&P 500 Futures
We got a strong rejection of the 1088 area on Friday, and we're currently building value above previous week's close (1098). I'm bullish above 1099, bearish below 1094 and neutral to slightly bullish in between. I'd hold on to Shorts a bit longer than Longs in this environment though.

Bullish Scenario
In the event of an up move, I'm anticipating price to offer pullbacks at the key resistance zones, and then continue rotating up. Ideally, price remains above 1098-1099, but we could also see a retrace down to 1094, followed by a bounce back above 1099. In that event, I'd be looking for continuation to the upside. 1103.50 is the Monthly VPOC, so that area may act as short-term resistance as well. In the event that price manages to move above 1109.50, I would anticipate a quick move up to 1111.50-1112 range extension area. There's also a lot going in the 1113-1115 area. On the upside, 1117 is a 100% extension of Friday's range. Pending some breaking news from the White House or other Govt agency, I'm not expecting price to just slice through all that resistance. Looks like it will take some work to make it through all that.

Bearish Scenario
In the event of a down move, I'm anticipating a bounce at Initial Support (1094-1095.50). If the bounce is weak, and we continue down, I would look for the selling to accelerate. I'm anticipating down moves to be fast paced, and on heavy volume. If we break 1088, anticipating a range extension down to the low 1080s, or more. On the downside, 1074.25 is a 100% extension of Friday's range.

ES - Daily Bar Chart with Volume Profile and Key Levels

Friday, December 18, 2009

Friday 12/18/2009 - S&P 500 Futures Market Review

E-Mini S&P 500 Futures (Options Expiration / Quadruple Witching)
The key levels and scenario posted last night worked very well today. I posted "we may get a small range extension to the downside, but I'm expecting the 1088s to hold as support" -- that worked out nicely. We got a 2.25 point range extension beyond yesterday's Low of 1090.75. Responsive buyers came in at 1088.50 and pushed price back into the Initial Balance. Beyond that, I was anticipating a test of the IB high, and we got that as well. Overall, the scenario worked out great! I hope you banked some $$$ going into the weekend! Review my annotated 5-minute chart for details.

ES 5-Minute Chart for 12/18/09 Includes Overnight Globex

Thursday, December 17, 2009

Key Levels & Scenarios (S&P 500 Futures) for Friday 12/18/2009

E-Mini S&P 500 Futures (Options Expiration / Quadruple Witching)
I'm anticipating tomorrow to be a range-bound day. We may get a small range extension to the downside, but I'm expecting the 1088s to hold as support. If you want to play it "safe", best bet would be to let the Initial Balance develop (first hour of day session), and then anticipate price to remain within the IB range for better part of the day. I'm not anticipating much of an extension past the first hour high/low.

Scenario
My bias is bullish above 1093 and bearish below it. Price is currently at the initial resistance zone. If it breaks above this zone (possibly overnight), the next area of strong resistance is 1099.50-1101.50 and I am anticipating a pullback on first touch. Above that we have some resistance in the 1103.50-1103.75 area. Buying could accelerate above 1103.75. Expecting 1109.50 to hold. On the downside, I am anticipating a bounce on first touch of the initial support zone. If we break below 1093, I'm anticipating a quick move down to the 1088-1089.50 area. Anticipating 1088 to hold. Below 1088, we could see a range extension down to 1084.75. Again, be aware of options expiration and be cautious buying new highs on the day or shorting new lows -- price could reverse quickly.

ES - Daily Bar Chart with Volume Profile and Key Levels

Thursday 12/17/2009 - S&P 500 Futures Market Review

E-Mini S&P 500 Futures
The scenario posted last night worked great today. We opened way below yesterday's IB Low, near the 100% range extension level, got a nice bounce back to mid-point and then rotated down all day (as anticipated). Check the 5-minute annotated chart to see how the levels and scenario played out. Hope you guys were able to bank on today's setups!

ES 5-Minute Chart for 12/17/09 Includes Overnight Globex

Wednesday, December 16, 2009

Key Levels & Scenarios (S&P 500 Futures) for Thursday 12/17/2009

E-Mini S&P 500 Futures
Anticipating range expansion and a trend day tomorrow. Pay attention to the overnight trend going into the open; anticipating that trend to remain intact for better part of the day. It goes without saying, that trades should be taken based on real-time price action. It's OK to anticipate, as long as you're willing to toss the idea if it's not working out.

Scenario
Initial support is in the 1100.25-1101.75 zone, with 1096.25-1097.50 below that on a range extension. On the upside, initial resistance is in the 1107.50-1109 area, with the range extension target/resistance around 1114. I'm bullish above 1109, neutral to slightly bullish above 1100 and bearish below 1099. Regardless of direction, I'm anticipating rotational moves where price takes a pause at the support/resistance zones, rotates 2-4 points and then continues in direction of trend. Opening above Wednesday's IB Low (1108) would also be bullish; bearish if we open below. Like I said before, note the trend in the overnight Globex session and trade in direction of trend, until it is broken. Currently, the trend is bearish, but price is trading within the Initial Support zone, so I would not initiate shorts in this area since I'm anticipating a bounce on first touch.

Economic Data
Jobless Claims out at 7:30 am (cst), Leading Indicators and Philadelphia Fed Survey at 9:00 am (cst). Trade well!

ES - Daily Bar Chart with Volume Profile and Key Levels

Wed. 12/16/2009 - S&P 500 Futures Market Review

E-Mini S&P 500 Futures
FOMC didn't generate the magnitude of price movement I anticipated, perhaps due to the quadruple witching this Friday, but still offered a couple of nice opportunities if you were patient, and entered trades at key levels. Price went through my initial resistance zone (1105.50-1107) during the overnight Globex session and hit a high of 1112. Price couldn't even extend to reach the 1112 Globex High in the Day Session (weakness) though. Price tested the Initial Balance High on the FOMC release, and sold off from there. If you used the mid-point and VWAP to establish bias, you either banked some profits, or at the very least, escaped with a small loss. There were a few reasons to scale out or exit in the 1103-1103.75 area. Selling shut off right at the 1103 Globex Low.

ES 5-Minute Chart for 12/16/09 Includes Overnight Globex

Key Levels & Scenarios (S&P 500 Futures) for Wednesday 12/16/2009

E-Mini S&P 500 Futures
Consumer Price Index and Housing Starts data out at 7:30 AM (cst), and the FOMC Meeting Announcement at 1:15 PM (cst). I'm anticipating range expansion in the afternoon. Many times price will move violently in both directions on the FOMC release. Use the Mid-Point and VWAP/VPOC as your line in the sand to establish bias. On the upside, expecting buying to shut off in the 1117.50-1119 area. On the downside, anticipating selling to shut off in the 1092-1094 area. These are just some rough targets; anything goes! If you're a relatively new trader, best option may be to just observe and absorb the price action so you're better prepared for the next FOMC day. Bias remains bullish above 1100, bearish below it but have to be cautious on the Long side as well since the 60-min chart is currently in a down-trend (possible change in trend above 1109.50). Trade well!

ES - Daily Bar Chart with Volume Profile and Key Levels

Tuesday, December 15, 2009

Tuesday 12/15/2009 - S&P 500 Futures Market Review

E-Mini S&P 500 Futures
Typical choppy price action ahead of the FOMC announcement. Despite the lack luster pace, there was structure in the (few) moves that materialized today. We got a nice bounce at 1103.25 in the morning (last night's post anticipated a bounce in the 1101-1103 area). From there, ES put in the high of day at 1109.50 (1109 was yesterday's IB high). Price remained under the Mid-Point and VWAP in the afternoon session (bearish), and we saw an acceleration in selling activity once price broke below the IB low. The down move was rejected with a quick move back towards the mid-point into the close.

ES 5-Minute Day Session Chart for 12/15/09


Crude (CLF10)
The triangle break-out I posted about last night worked out to the upside and reached the 138.20-161.80% target zone.

CL - Hourly Chart

Key Levels & Scenarios (S&P 500 Futures) for Tuesday 12/15/2009

E-Mini S&P 500 Futures
Market is holding up fairly well so far. Price consolidated above the previous VPOC (bullish). We got a 61.8% retracement on the 60-minute chart, and price has been trending higher from there. In the overnight session, near-term bias is bullish as long as price remains above 1108. The initial resistance zone is 1113-1115, with range extension target/resistance in the 1116.50-1118 area. Below here, we have several cushions of support (highlighted in key levels chart).

Scenario
Producer Price Index at 7:30 AM (cst), Redbook at 7:55 am, Industrial Production at 8:15 AM. FOMC meeting begins tomorrow with the announcement on Wednesday. If we get a negative reaction to the Econ data, price could push through the initial support and tag 1101. I am anticipating a bounce in the 1101-1103 area. A positive reaction could take us to the 1118s; I'm anticipating a pullback there. Bias is bullish above 1101, and bearish below it.

ES - Daily Bar Chart with Volume Profile and Key Levels


Crude (CLF10)
For Crude traders, decent move developing on the hourly chart. Anticipating triangle break-out.

CL - Hourly Chart

Monday 12/14/2009 - S&P 500 Market Review

E-Mini S&P 500 Futures
As posted last night, the market consolidated in a range while it digested the latest news. The plan called for buying support and shorting resistance, and that worked well so long as you patiently waited for price to get near the support/resistance zones.

ES 5-Minute Day Session Chart for 12/14/09

Sunday, December 13, 2009

Key Levels & Scenarios (S&P 500) for Monday 12/14/2009

E-Mini S&P 500
I was about to post the levels and the Dubai news hit the wires, spiking the ES up to 1113! I had initially marked 1105.25-1106.75 as initial resistance, and that was promptly changed to read "Prior Resistance = Support", so anticipating a bounce in that area. 1111.25-1114.75 was the Range Extension/Resistance, and 1112.25 was the 100% extension of the swing on the Hourly chart. 1106.25 is currently the Mid-Point, and also the Previous Week's High, so we have some confluence there. Near-term bias is bullish!

Scenario
I'm bullish above 1103.75, and am anticipating a bounce on first touch of each support zone on the way down. Anticipating range-bound action tomorrow as the market digests the latest news. In a range-bound market, I'm looking to go Long at Support and Short at Resistance. Immediate trend is up though, so must be careful on the short side and take profits early and often. Trade well!

ES - Daily Bar Chart with Volume Profile and Key Levels


Crude (CLF10)
For Crude traders, here's how the Hourly chart for CLF10 is working out.

CL - Hourly Chart

Friday, December 11, 2009

Key Levels & Scenarios (S&P 500) for Friday 12/11/2009

E-Mini S&P 500 (March 2010 Contract)
Volume shifted to the March 2010 ES contract towards the afternoon, and going forward, the key levels will be for the March contract. I was busy attending a technology event this evening, and didn't get home till later, which means less time for market analysis. I didn't have much time, but managed to put together some levels for the March contract.

1097.25-1099 is an accepted area at this point, so I'd like to see it hold for continued upside (currently trading at 1100.25). The initial resistance zone is 1103.50-1105.50 and initial support zone is 1093-1094.50. We have a few economic releases tomorrow morning which will probably result in quick volatile moves, so we could blow through the initial support/resistance zones in a hurry. If price is still trading around 1100, I would anticipate a bounce around 1090 and a pullback around 1110, on the econ release move. Make a note of the trend going into the economic release; don't overstay in the counter-trend move - price could reverse again and continue on its original path (trend). As long as you have a plan in place, you won't be shocked/surprised by the moves.

Retail Sales and Import and Export Prices out at 7:30 am (cst). Consumer Sentiment at 8:55 am (cst) and Business Inventories at 9:00 am (cst).

ES - Daily Bar Chart with Volume Profile and Key Levels


Crude (CLF10)
For Crude traders, here's how I'm seeing the levels on the Hourly chart for CLF10.

CL - Hourly Chart

Thursday, December 10, 2009

Thursday 12/10/2009 - S&P 500 Market Review

E-Mini S&P 500
Last night's Key Levels & Scenarios post nailed today's price action very well! My near-term bias was bullish, and 1091.25-1092.50 was posted as initial support. 1092.50 ended up being the Globex Low. After that, 1099.75-1101.25 was posted as Initial Resistance, and we got nice pullbacks in that zone. I was anticipating a test of those levels in the Globex overnight session, and that panned out as well. Once price broke through that zone (on third attempt), the area of resistance now became an area of Support. We opened above that zone and price hit a high of 1106.25 (1105.50-1108 was posted as Strong Resistance). Price hit that resistance zone and pulled back to 1100 (new support zone). The second push up hit a high of 1105.50 (to the tick) and pulled back into support.

Post in the comments section if you followed my levels & scenarios from last night and let me know how you did! I'd like to know that the Key Level posts are helping other traders bank some $$$

ESZ9 5-Minute Chart for 12/10/09 Includes Overnight Globex

Wednesday, December 9, 2009

Key Levels & Scenarios (S&P 500) for Thursday 12/10/2009

E-Mini S&P 500 (December Contract)
The levels haven't really changed much, so please refer to yesterday's Key Levels chart.

Upside
1099.75-1101.25 is still the initial resistance zone (good chance to tag it in Globex), with 1105.50-1108 as strong resistance above that area. After that, 1110 is the 100% range extension, which may also act as a temporary barrier to further upside.

Downside
On the down side, the initial support zone is 1091.25-1092.50, followed by 1085 and 1082.50. The support zones haven't really changed much.

Scenario
Today's VPOC was around 1092.50, and we closed on the highs so my near-term bias is bullish. International Trade and Jobless Claims data out at 7:30 am cst tomorrow morning. I'm anticipating a trend day with some conviction on direction. The plan is to be patient, identify the trend, and then enter in direction of trend on pullbacks. Even if the trend is up, taking short trades in the 1107-1110 area is a relatively safe bet. On the other hand, if the trend is down, I'd be cautious entering Long (counter-trend) at initial support (1091.25-1092.50) but anticipate a bounce in the 1082.50-1085 area. It's also contract rollover tomorrow, and volume will gradually shift from the December 2009 contract (ESZ09) to the March 2010 contract (ESH10) over the next couple of days. The support/resistance numbers I've mentioned above are for the December contract.

Wednesday 12/09/2009 - S&P 500 Market Review

E-Mini S&P 500
The scenario put out last night anticipated consolidation and rotational moves and the plan was to fade the edges, i.e. the support/resistance zones -- and that worked out very well. Review my annotated 5-min chart to see how the levels played out.

Also guys/gals, if you have questions on a specific chart or blog post, please use the Comments section so others can benefit from the answer. If you have any other question, post it in the Comments section of the Ask E-Mini Player blog post. Thanks!

ESZ9 5-Minute Day Session Chart for 12/09/09

Tuesday, December 8, 2009

Key Levels & Scenarios (S&P 500) for Wednesday 12/09/2009

E-Mini S&P 500
1093.50 (VPOC) is the level "in-play" at the moment. Price needs to break above that for some momentum to the up side. I'm anticipating consolidation and rotational price action tomorrow. Anticipating bounce at first touch of each support zone, and a pullback at first touch of each resistance zone. The chance of a fast move through the support/resistance zones is less likely (but of course anything is possible).

Above 1093.50
Above 1093.50, the near-term resistance levels are 1095.75 (not significant) and 1097.50. Price has already tested 1097.50, so I'm hesitant to fade it on the next leg up. I would feel more comfortable stalking a short entry in the 1099.75-1101.25 zone. We have an open gap at 1103.75 above that. Rubber meets the road at 1108 (big #).

Below 1092.50
Below 1092.50, I would anticipate a test of the 1085-1086.75 area, with a bounce on first touch. Below that, I'm anticipating a test of 1080.25-1082.50; again with a bounce on first touch.

Like I mentioned before, I'm not expecting a trend day so fading the edges is the plan for now. If the situation changes, and we get a big move in one direction, then the plan would be to enter in direction of trend on pullbacks. Trade well!

ES - Daily Bar Chart with Volume Profile and Key Levels

Tuesday 12/08/2009 - S&P 500 Market Review

E-Mini S&P 500
Very structured price movement today! The levels and scenarios played out well. I was anticipating a trend move out of that triangle on the Hourly chart, and that worked itself in the overnight session.

ES Hourly Chart


I was anticipating a bounce on first touch of the 1091-1093 support zone, and we got a 3.75 point bounce at 1093.00 and a 4.50 point bounce at 1092 in the overnight session, so the 1091-1093 was a good support zone to take trades against. 1086.75 was the range extension / support, and price put in the Low of Day at 1087.75. Once the low was in, we saw symmetrical swings up to 1097.50 (symmetry is not drawn on chart).

ES 5-Minute Day Session Chart for 12/08/09

Key Levels & Scenarios (S&P 500) for Tuesday 12/08/2009

E-Mini S&P 500
I'll be pretty busy with technology work for remainder of the week, so the posts will be brief. We've been coiling for a few weeks now, and if there's one thing you can count on in the market (and in life), it's Change! I'm anticipating a big and fast move in the near future; perhaps even as early as tomorrow. Here's the Daily ES chart showing the Big Picture:

ES - Daily with Fib Projection/Retracment Levels


As you can see, price nearly hit the 138.20% upper target on the previous swing before selling off and testing the lower end of the channel. We've already hit the 127.20% extension at 1119 in the current up swing.

I'm anticipating a break-out move based on the triangle pattern on the Hourly chart.

ES Hourly Chart


Short-term bias is bullish above 1101 and bearish below 1099. Please refer to Key Levels chart for support/resistance. If we break below 1101, I'm NOT anticipating a bounce at 1099. Instead, I'm anticipating a move down to 1093 with a bounce at first touch of the 1091-1093 support zone. Beyond that, we could tag the 1086 and 1082 areas. Above 1108, I'm anticipating a move to the 1118-1119 zone, and a pullback on first touch. I'm not expecting price to sell off if it tags 1119; instead I'm anticipating a pullback and another push to 1122+. I'm anticipating a trend day so will be very careful in fading the momentum into support/resistance areas tomorrow. I think we're going to slice through some of these levels when price starts moving, so I'll be waiting for confirmation before taking any counter-trend trades.

Redbook out at 7:55 AM (cst) tomorrow morning. Trade well!

ES - Daily Bar Chart with Volume Profile and Key Levels

Monday, December 7, 2009

Monday 12/07/2009 - S&P 500 Market Review

E-Mini S&P 500
The 1099-1100 support zone highlighted last night worked out great today! As I've mentioned in prior posts, I use 6-8 tick stops, and move the stop-loss to break-even as soon as the position goes a few ticks in my favor. Initiating trades at Key Levels is the only way the tight stop-loss can work for me. Entering a trade in the middle of the range requires a wider stop since the near-term support/resistance level is further away from the entry, but if you initiate trades at the Edges (Key Levels), you can set a tight stop and be confident that the area may hold IF your trade hypothesis is correct. In the event that your trade hypothesis is not correct, you want to be stopped out quickly anyway! Your stop is the amount you're willing to risk in order to find out if your hypothesis is correct. But the stop can't just be an arbitrary amount like 4 ticks or 6 ticks; it needs to be logical as well. You only want to be stopped out if your trade idea is wrong. It's very similar to the blind in Poker. Gotta pay to play :)

Check out today's annotated 5-minute chart to see the areas that offered good risk/reward setups. Keep it simple!

ES 5-Minute Day Session Chart for 12/07/09

Key Levels (S&P 500) for Monday 12/07/2009

E-Mini S&P 500
I was busy with technology work again this weekend, and it's already past 1:15 AM so tonight's post will be brief. Friday set a higher high and lower low compared to Thursday, but price remained above the 1091 level I mentioned Thursday night and managed to close above the mid-point at 1108, which is also the weekly and monthly VPOC. That's a key level that you're going to want to keep an eye on tomorrow. If we stay above 1108, there's a good chance of tagging that big 1122 level. Think of the number of stops above 1122! I would not fade 1122 on first touch. If we get a double-top at 1122, then maybe, I'd consider fading it. My current bias is bullish above 1099, neutral between 1093-1099 and bearish below 1093.

Don't have time to post scenarios tonight. Please refer to the Key Levels chart for areas of support/resistance. Same story as always; anticipating bounce on first touch at support, and a pullback on first touch at resistance. Good luck and trade well!

ES - Daily Bar Chart with Volume Profile and Key Levels

Friday, December 4, 2009

Friday 12/04/2009 - Market Review

E-Mini S&P 500
Levels and scenario worked out pretty well today. I mentioned last night that last month's NFP release produced a 15-16 point swing in one direction followed by a 15-16 point swing in the other direction, and that's similar to the action we saw earlier this morning. If you look at the 7:30 AM (cst) 5-minute candle, the Low is 1098.75 and price raced up to 1114 by 7:40 am (15.25 pts). Price then pulled back to 1109 before making a final 10 point push up to 1119 (1119 was a level I mentioned last night). ES sold off from there, but chopped in the 1109.50-1112 range before selling off hard all the way down to 1096.25. Like I mentioned last night, you don't want to get in the way of momentum on NFP day.

I'm not going to step through the entire day, but have annotated a 5-minute chart with some thoughts on how I viewed the day's price action. Next week, keep an eye at that 1108 area. It's the Weekly VPOC. Take care, and have a good weekend!

ES 5-Minute Day Session Chart for 12/04/09

Thursday, December 3, 2009

Key Levels and Scenarios (S&P 500) for Friday 12/04/2009

E-Mini S&P 500
Since I was busy with technology work tonight, I wasn't planning on posting the levels/scenarios, but I saw Charlotte's comment and decided to post some thoughts for tomorrow. First thing to keep in mind is that Non-Farm Payroll data comes out tomorrow morning at 7:30 AM (cst) and it is a market moving event! The last NFP release produced a quick 15 point swing down followed by a 15-16 pt swing up, so do NOT fight the momentum and enter your trades at Key Levels off the reaction. If you're a newer trader, it's probably best to just lay out some scenarios and watch from the side lines. Let the initial balance (first hour of trading) develop and then enter the market based on where price is in relation to the First Hour High/Low (Initial Balance) and the Mid-Point. Use the Mid-Point as your Line in the Sand -- Long bias above it, Short bias below it. My bias at the moment is bullish!

We're currently building value above 1096 in the over night session, and I'd like to see price remain above 1094.50 over night for some bullish action in the morning. With the NFP release, price could push hard in either direction and then do a complete 180 and head the other way. I have no clue which way it will move! On the positive side, I don't need to know which way it will move.

Bullish Scenario (above 1091)
1091-1092 area is the initial area of support, and under normal market conditions I would anticipate a bounce on first touch, BUT with the NFP release in the morning, price could easily slice right through it and head to the 1085 area. Even with the expected increase in volatility, I am anticipating a bounce in the 1082.50-1085 support zone. On the up side, the areas that held as support may now act as resistance. Anticipating initial resistance at 1103.25, but again, if we get a positive response to NFP, price could easily push right through to 1108 or even 1111. I am anticipating the 1110-1111 area to provide a 3-4 point retracement on first touch so it's a good place to scale out of Longs. Beyond 1111, we have 1115.50, then 1119 and finally that big 1122 level! Is it possible to tag 1122 tomorrow? Yes! Anything's possible in the market. I never close myself off to where price could go.

Bearish Scenario (below 1089)
1089.25 is previous week's mid-point and close. The levels below 1089 are pretty well defined. We have 1082.50-1085 as support. I would definitely scale out of Shorts in that area since a bounce is likely. If we break 1082.50, we have 1076.50, followed by 1071.75, 1067 and finally 1063.75.

Good night, and good luck tomorrow!

ES - Daily Bar Chart with Volume Profile and Key Levels

Thursday 12/03/2009 - Market Review

I noticed the Blog has gained a few new followers. Welcome to the Blog and I hope we can collaborate and improve each others understanding of the markets!

It's worthwhile to go over today's market action to connect the Key Levels posted last night with today's price action. Lets start from the open and go through the day step by step (this is an exercise I do everyday on my own after market close):

  • Market gapped up 2.75 pts at the open and extended beyond the Globex High and hit 1117, which served as resistance and we got a strong rejection at that level.
  • Selling pressure accelerated once price broke down through the mid-point and VWAP (Vol Trend).
  • 1108 was posted as the Key Initial Support level, and price bounced up from 1108.25 to 1111.50 (3.25 pts).
  • Break of 1108.25 took us to 1105.50 (2.75 pts). 1105 was also posted as a level, and my bias was bearish below 1105. The first bounce off 1105.50 took us to 1109.25 (3.75 pts).
  • Price rotated down again and hit 1105.25 (1105 level working beautifully here). This time we got a strong bounce up to 1110.75 (5.50 pts).
  • 1111 area was the Mid-Point and price remained below this area rest of the day. One of my trading rules states: "If Price is less than Mid-Point; Only take Shorts unless Price is rejecting a lower area of support such as the Lower Value Area."
  • Price was then range-bound between 1107.25-1110.75 (3.50 pts). We had a cluster of VPOCs in the 1107-1108 area.
  • Around 2:20 PM (cst), price broke down through the first hour low on accelerated momentum. Last night's post called for a bounce on first touch at 1100.25, but given the time of day (late afternoon), I'm not surprised that we did not get a bounce. Typically, if price is below the initial balance (1st hour low) in the afternoon, it has a tendency to close at or near the lows.
  • The next level after 1100.25 was 1097, and we closed at 1097.50. Price is currently trading at 1098.50 in the Globex session.

    Review the following annotated 5-minute chart and see how the day played out. If today's price action surprised you, then it could be a sign that you need to come better prepared. I hope this post clarifies some of the concepts I utilize, and connects the nightly key levels to actual price action.

    ES 5-Minute Day Session Chart for 12/03/09
  • Wednesday, December 2, 2009

    Key Levels and Scenarios (S&P 500) for Thursday 12/03/2009

    E-Mini S&P500
    I was busy last night and wasn't able to post the key levels and scenarios, but my bias has been bullish and we tagged the 1115 level that I mentioned in my last post from Monday night. At this point, I still don't see any sign of weakness in the S&P. For the past three days, prices have either remained in the upper half of the previous session's range, or extended to the upside. As I type this (12:30 AM CST), ES is trading at 1114.25 (1111.50 is near-term support over-night now), building value above Wednesday's VPOC. My current bias is bullish above 1108. Shorts are counter-trend at the moment.

    Jobless Claims and Productivity and Costs data out at 7:30 AM (CST), ISM Non-Mfg Index at 9:00 AM (CST) tomorrow morning. To top it off, both Ben Ber"tank"e and Barack Obama, speak sometime tomorrow which could move the markets. Be careful...and do NOT fight the momentum! If you are going to enter counter-trend trades, initiate them at Key Levels so you can bail at close to break-even if you happen to be on the wrong side of the market.

    Bullish Scenario (above 1108)
    1108-1109 is initial support, and I'm anticipating a bounce on first touch. Below that, we have a VPOC Cluster in the 1105-1107 area, and then strong support in the 1100.25-1102.25 area. On the upside, some chop/rotation in the 1115 area wouldn't be a surprise. Beyond 1115, I would scale out of Longs in the 1117.75 area, and move stop-loss on remainder to 1115 at that point. We also have that 1122 level above that's just begging to be tagged!

    Bearish Scenario (below 1105)
    Support levels are defined, and I'm staying out of shorts between 1108 and 1115. I would consider shorts on an extension to the 1119.75-1122 area. If we break below 1105, the 1108 level could then act as short-term resistance. Shorting the bounce at that point in anticipation of a move down to test the 1101-1102 area would be a decent play. There is a cushion of support from 1108 all the way down to 1100.25, with 1100.25-1101.50 being pretty strong. Anticipate a bounce on first touch, which means it's a good place to scale out of shorts and then re-load if price remains below 1108. The bounce could be pretty damn strong though, so be careful initiating shorts on a bounce at 1100.25. By that, I mean, don't re-load at 1103; wait for the momentum to stall on the bounce as price could easily retrace back to 1108.

    ES - Daily Bar Chart with Volume Profile and Key Levels